How common is slavery around the world? Depicting its extent is important in order to focus political attention on this affront against human rights. But some of the numbers in the Global Slavery Index come together in unconventional – and sometimes obscure – ways. A trip into the fine print.
A professional organization with an office in Berlin promotes its fundraising like this: “Imagine if almost the whole of Potsdam were enslaved.” The reference to Berlin’s neighbouring city gives life to the figure of 167,000 people who “live in slavery in Germany today”. In France, the city of Aix-en-Provence could stand for the 129,000 slaves in that country. Half the city of Southampton might represent the figure in Britain.
The organization does not take responsibility for the figures it uses. These come from the Global Slavery Index, or GSI, published by the Australian initiative Walk Free. It, in turn, is financed by a foundation funded by Andrew Forrest, Australia’s second-richest man in 2021. Whether it is data on forced labour, forced prostitution or forced marriage, anyone examining slavery worldwide cannot avoid the GSI. Its figures are widely used in civil society publications. They have also found their way into official documents since Walk Free started collaborating with the International Labour Organization (ILO), and are even cited in scientific reports, albeit more as an illustration than as a basis for argument.
The Global Slavery Index currently has data on over 167 countries. The world media take notice when a new index appears. After editions in 2013, 2014 and 2016, the most recent version is now from 2018; the next one is due out in 2022. The findings are hard to compare because the bases for the data and the calculations change with each edition. But the principle stays the same: the available data are extrapolated to fill in the missing information, thereby plugging the gaps in this understudied topic.
An estimated 167,000 slaves in Germany – that is an astonishingly high number. The data on which the indices for the GSI’s four existing editions are based are from 2012 to 2016. According to the GSI website, in 2016 the German authorities identified 536 victims of human trafficking, 488 victims of forced prostitution and 48 of forced labour. An older study from 2008 reports that around 3,400 women and girls sought assistance from counselling centres because of actual or threatened forced marriages. The true extent of forced labour, trafficking, forced prostitution and forced marriages cannot be deduced from these numbers. But should the GSI’s figure really be over 310 times higher than the number of cases that were officially recorded?
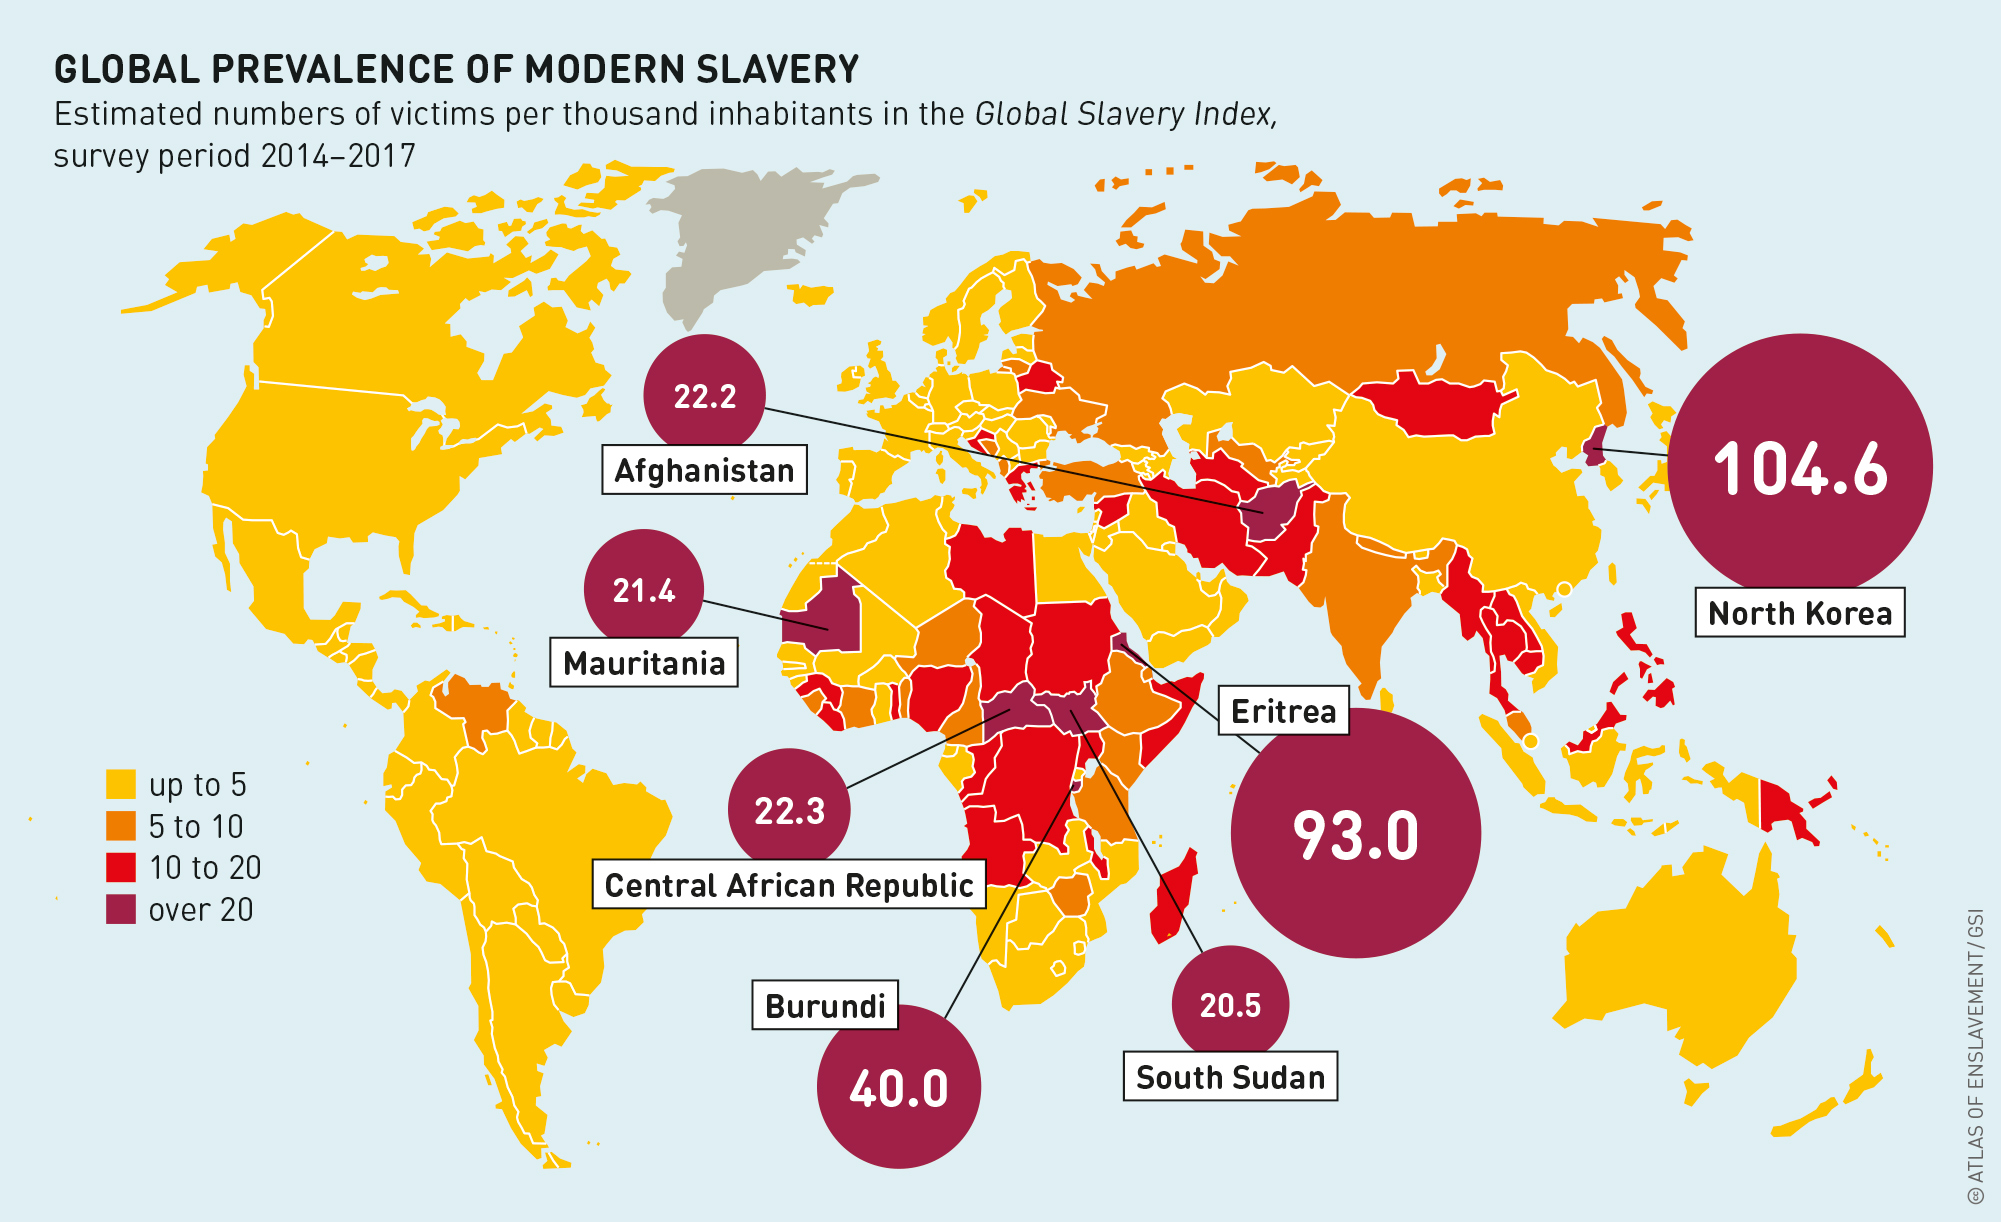
To answer these and other questions, it is necessary to take a trip through the fine print. And there is a lot of it. Through methodological sections, appendices, footnotes, supplements and online material it is possible to reconstruct some, but not all, of the steps that led the four editions of the GSI to the figures it has published. The key number in the GSI is the approximate prevalence of victims of modern slavery per 1,000 inhabitants. This estimated prevalence is, according to the most recent GSI, around 2.0 per thousand for both Germany and France. For the United Kingdom the figure is 2.1, while for the Netherlands it is 1.8.
The first index in 2013 had completely different numbers. For Germany, a figure of 10,646 slaves was calculated, only 6 percent of the 167,000 slaves of 2018. The 2013 logic was this: estimates were available for the United Kingdom and the USA. The mean of these was used as the lower limit for western Europe, said the GSI publication without offering an explanation. The upper limit was the mean value for estimates for the eastern and southeastern European countries of Belarus, Ukraine, Bulgaria, Romania and Moldova. That gave an average for Germany of 0.13 per thousand. Multiplying that by a population of 81.9 million gives 10,646 slaves. This is accompanied by a note saying this is a best possible estimate, not the real number. But this figure is repeated in subsequent tables for Germany.
For the 2014 index, the GSI team divided the countries of the globe into seven categories according to socioeconomic criteria such as population size, density and poverty. There followed further extrapolations. Here is an example: Cambodia, for which no data were available, landed in a group with “similar” states such as Niger and Haiti, for which the team estimated a slavery prevalence of 15 per thousand inhabitants. Then it was noticed that Cambodia’s somewhat closer neighbour Indonesia, which was assigned to a different category, had a prevalence of only 3 per thousand. The solution: introducing a criterion of “regional similarity”, so giving Cambodia a prevalence of 40 percent of the value for Indonesia plus 60 percent of the mean of Niger and Haiti. That yielded a prevalence of 10.3 per thousand. Multiply that by the population, and we end up with 155,800 slaves in Cambodia.
The next GSI from 2016 was based on 25 country surveys, three studies taken from other sources, and 139 extrapolations for countries for which no data were available. The table for the 167 countries was calculated in the following way. Based on the political, economic and social data from 24 international indicators to profile the risk of slavery in a country, the team placed each of the 167 countries in one of 12 categories. The prevalences of the 28 countries for which survey data were available were transferred to the various categories. Exactly how this was done is a mystery.
The 2016 GSI does not list the 139 countries in each of the 12 categories, but only gives the number of countries in each category. For example, survey data from Bolivia and Vietnam were used to estimate the prevalence of slavery in 17 undetermined countries. Cambodia, where a study had meanwhile been conducted, alone determined the prevalence figure used in 12 other countries. For 17 countries in two categories, no suitable comparable country was available, so they were allocated the prevalence figures from less similar countries. Finally, the team made “adjustments” to the figures for 40 countries. That step meant that many of the assignments to the 12 categories that appeared to be inappropriate were changed retroactively. Previously, the team had already plugged the inevitable gaps in the 24 international source indicators using values that were themselves based on those of similar countries. For the United Kingdom and the Netherlands, however, completely different numbers were chosen. These were based on a new method of evaluating individual cases from various lists of victims. This led to the number of slaves in the United Kingdom to rise from 8,300 to 11,700, and that in the Netherlands from 2,200 to 17,500. Why the same methods yielded such different results is not explained. For Germany the number of enslaved rose to 14,500, presumably because it belonged to the group of countries for which the United Kingdom served as the reference.
In 2018, the fourth and newest edition of the GSI appeared. The number of enslaved people in the Netherlands, which was presented as very accurate two years previously, rose by another 60 percent, to 30,000. For the United Kingdom, calculated in 2016 with the same new method, shot up 11 times to 126,000. Similar jumps occurred in Germany and France, with 167,000 and 129,000 enslaved people respectively – hence the references to Potsdam and Aix-en-Provence. The methodology in 2018 was again new. For the first time – and usefully – the various forms of modern slavery were separated out: into state and private forced labour (including forced prostitution) plus forced marriages; into adults and children; and into men and women. This time, the GSI team took the prevalence figures for 167 countries and the world as a whole from three types of sources: 48 country surveys conducted for the GSI, a collection of officially registered cases, and – for state forced labour – expert opinions.
In 2012, a study by the ILO estimated that there were 21 million forced labourers worldwide. In 2017, the Walk Free Foundation teamed up with ILO to calculate the Global Estimates of Modern Slavery. It produced an estimate of 25 million. These global estimates, which were incorporated into the GSI in the following year, are also astonishing.
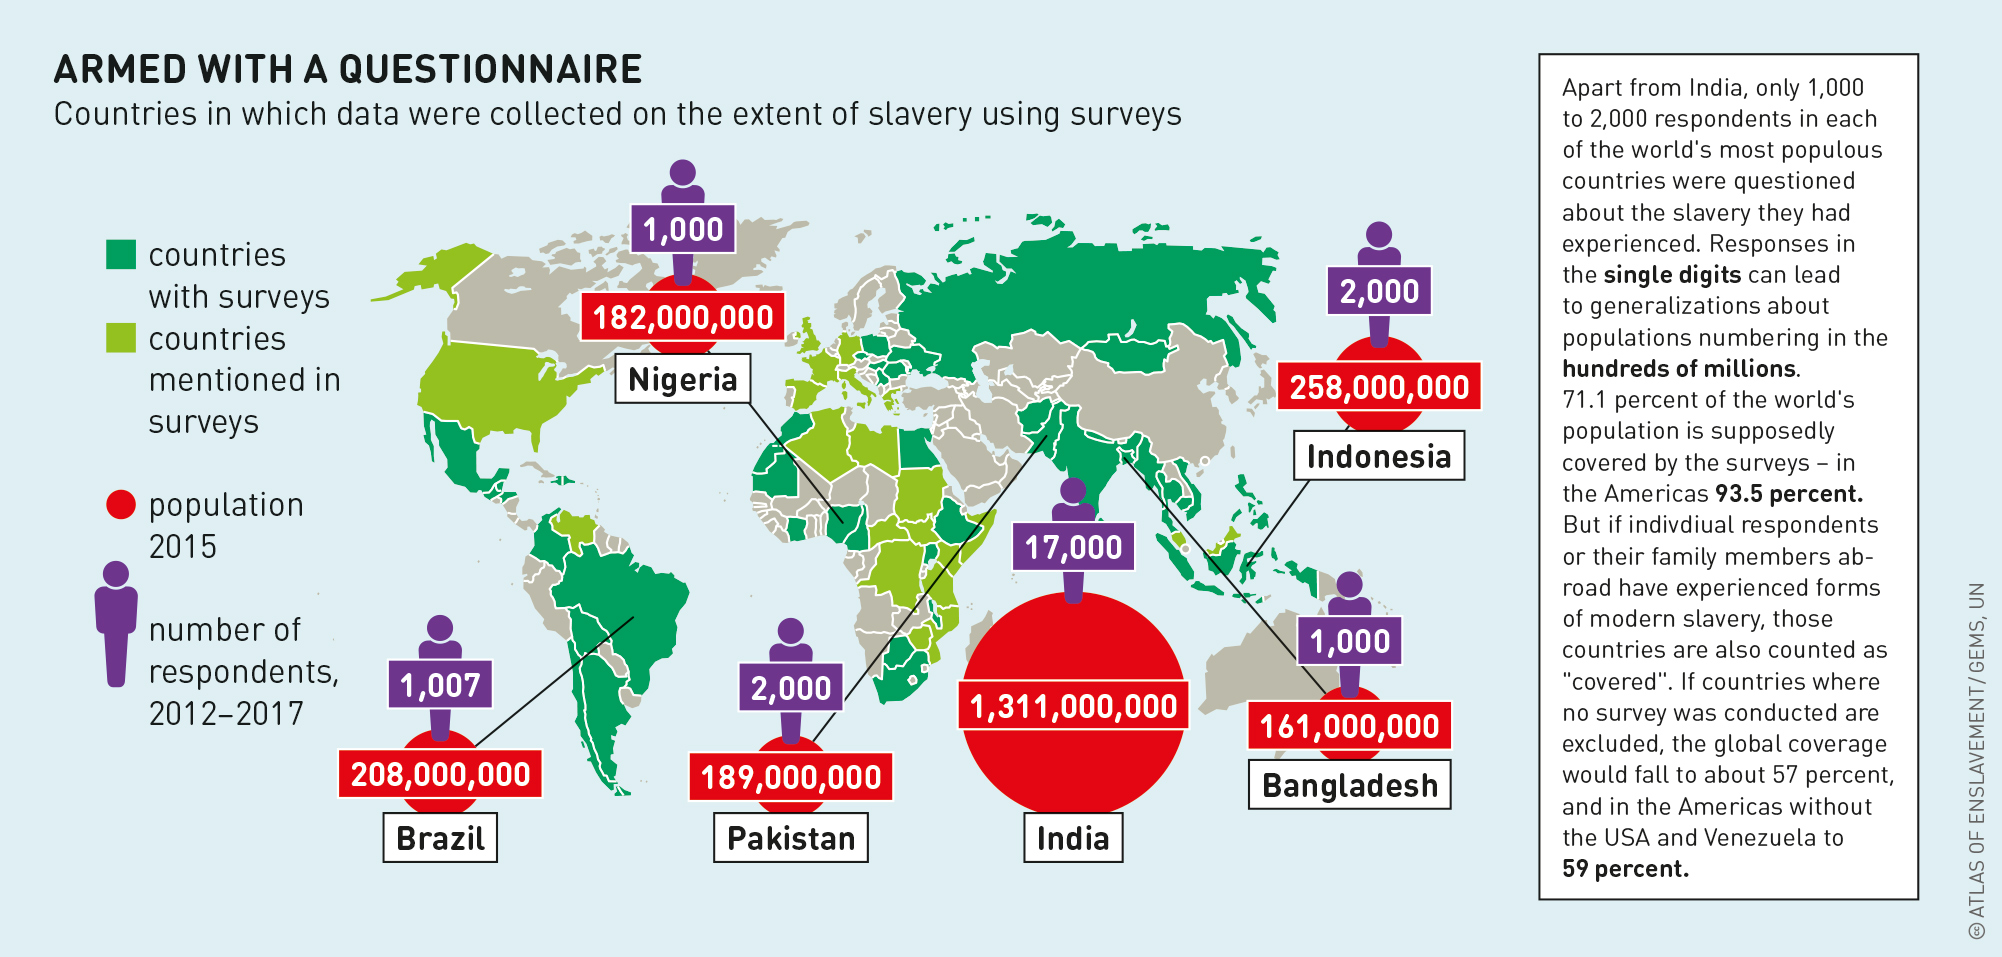
The US polling organization Gallup, which operates worldwide and conducted the surveys, states that the 48 country surveys were representative. The GSI team argues that 71,000 people were questioned around the world. They also testified on behalf of their families, so a total of 575,000 people are claimed to be covered.
But even in many countries with over 100 million people, just 1,000 or 2,000 people took part in the survey. How rough are the findings for a country like Brazil, with 206 million inhabitants, when 1,007 respondents are questioned about their experience with slavery? According to the GSI, Brazil has a slavery prevalence of 1.8 per thousand. So just two of the Brazilian respondents must have given corresponding responses to the survey. On the basis of their evidence, 369,000 people in Brazil are enslaved, says the GSI.
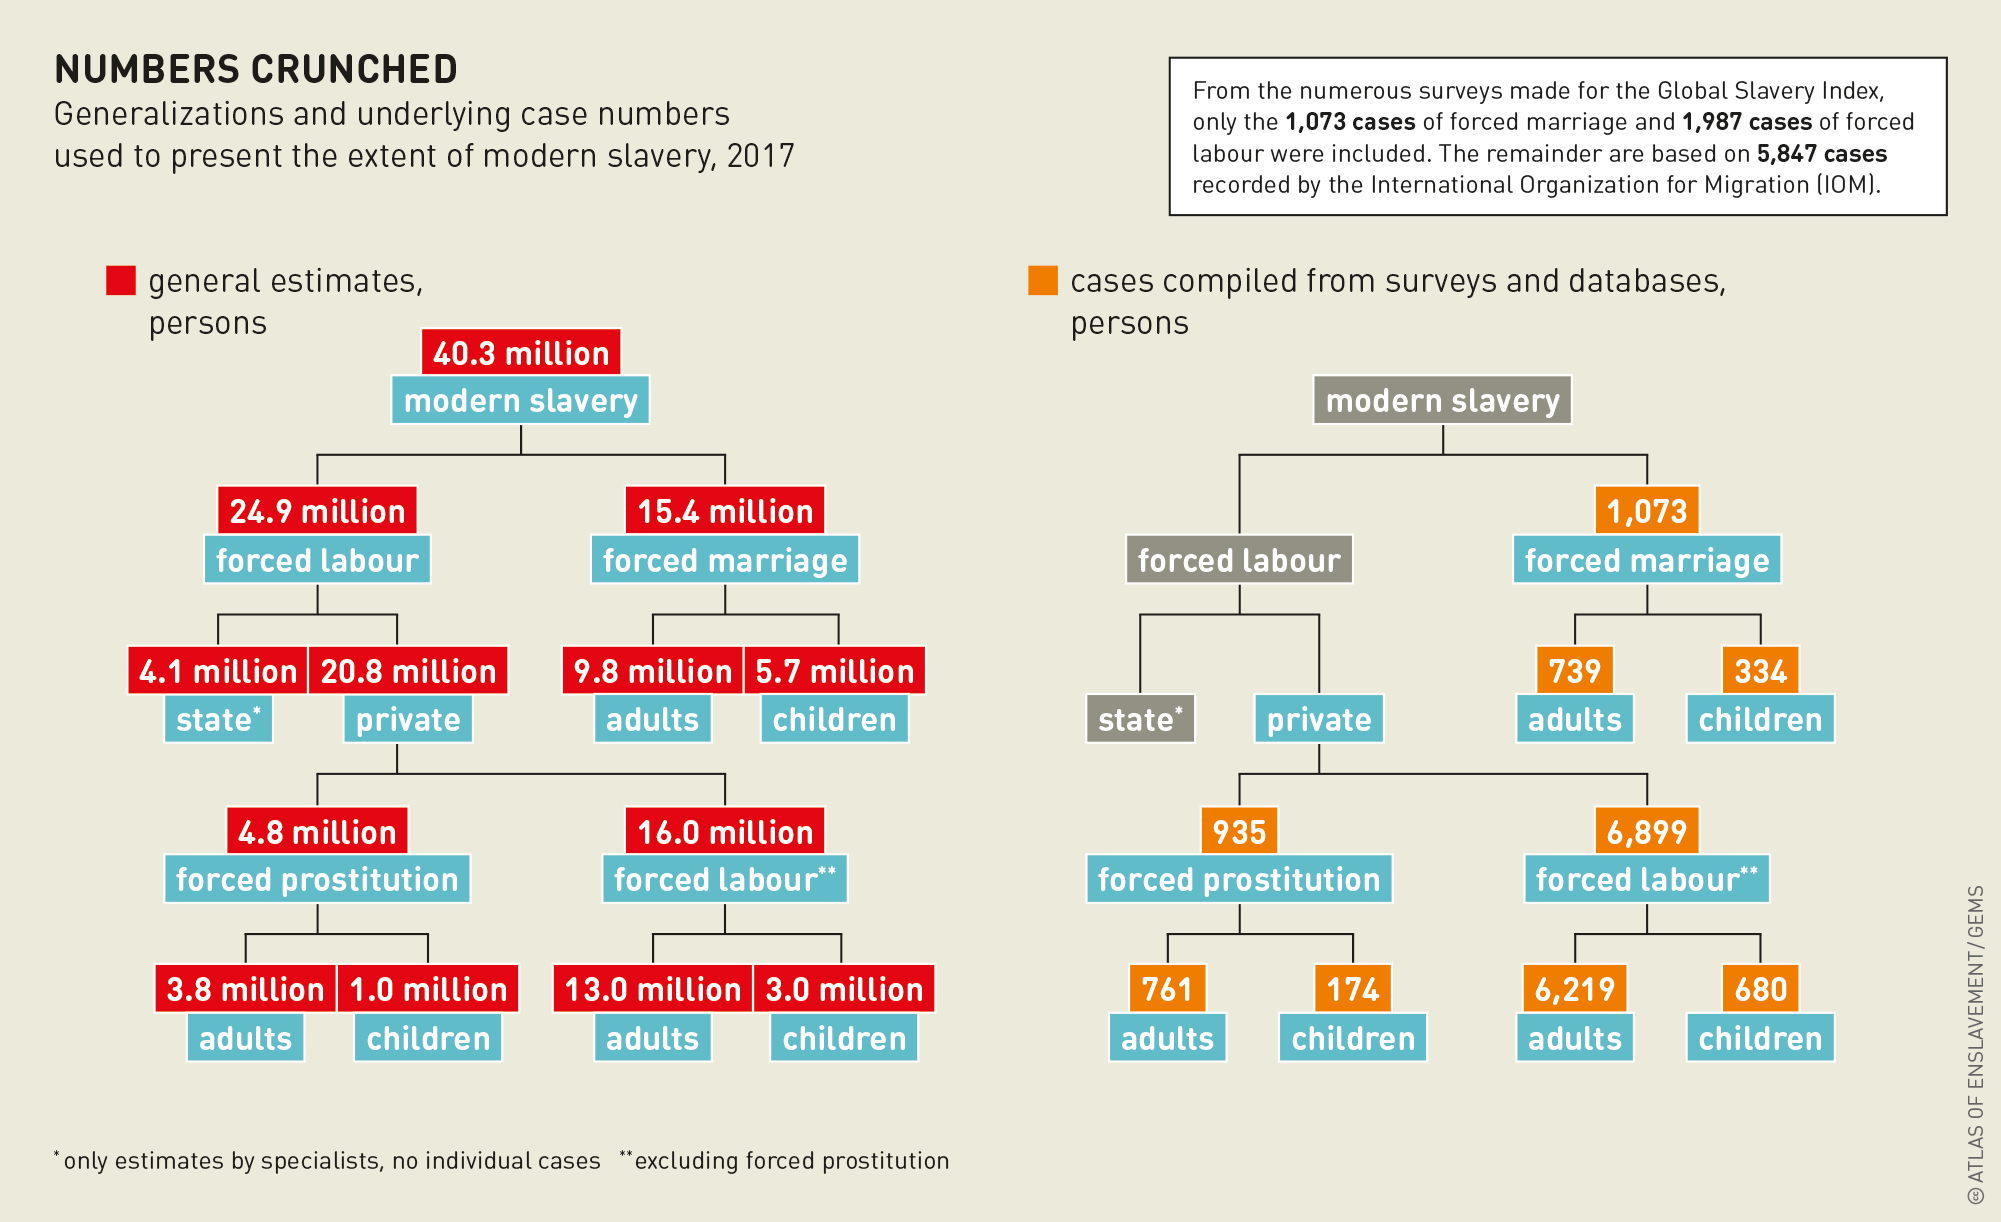
The results of the individual country surveys are not published in the GSI, nor are they available elsewhere. In reality, the 48 surveys must have produced much less information. In a methodological supplement to the Global Estimates that gives the number of cases used worldwide, only about 3,000 records of forced labour and forced marriages were derived from the surveys, which supposedly covered 5.5 billion people, or 71.1 percent of the global population. Some 5,850 records of forced labour or forced prostitution were drawn from the second type of source, the collection of officially registered cases maintained by the International Organization for Migration (IOM). Altogether, that makes precisely 8,907 cases. The third source is of a completely different nature, so is not included in the individual cases. The figures for forced labour by states were compiled for every country in the world by specialists associated with ILO and from publications. The state sector accounts for 4 million forced labourers in 20 countries. It is not possible to determine its influence on the prevalence figures: a table with the number of cases in each country has not been published.
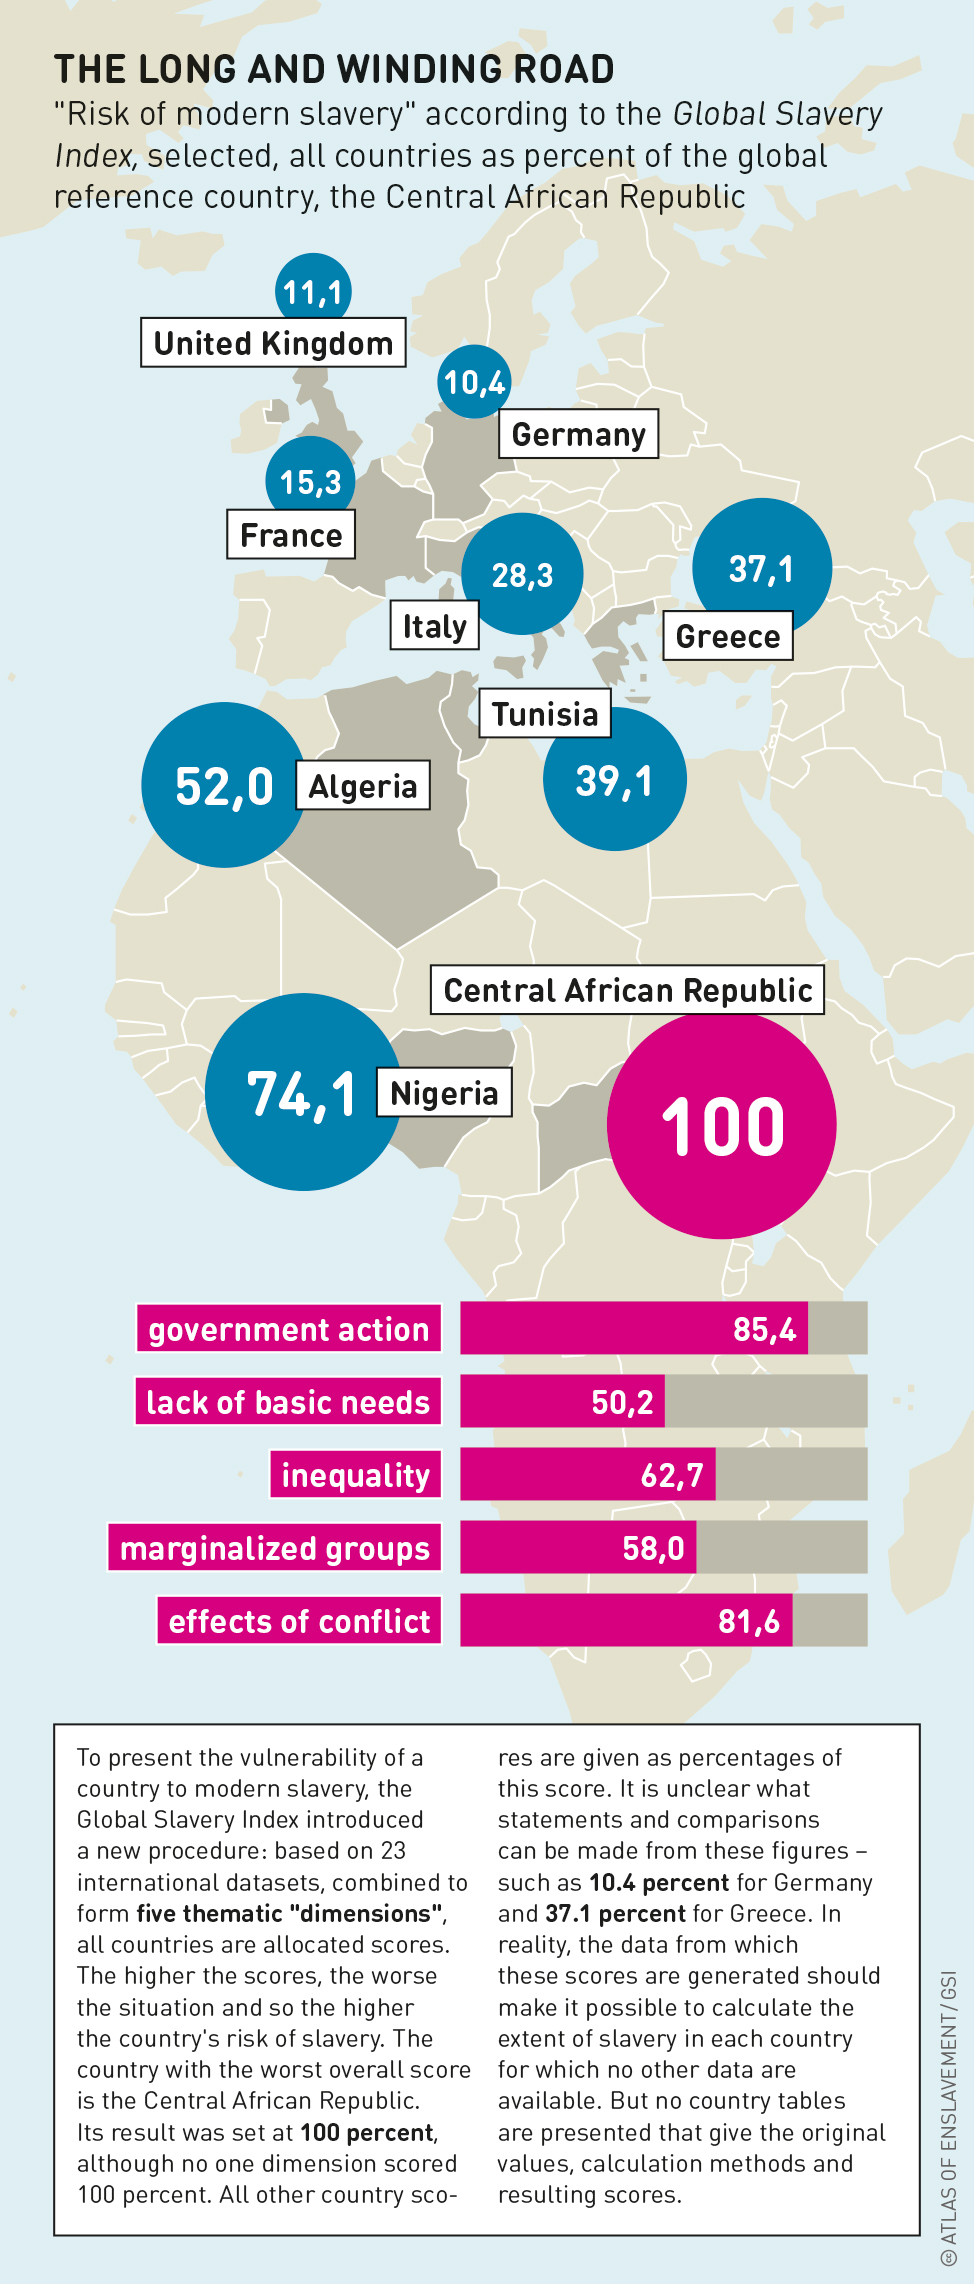
Both the survey findings and the calculated values pose questions. The “vulnerability to modern slavery” is derived from 24 collected datasets in five “dimensions”. Alongside the usual socioeconomic indicators, the list of datasets includes components such as “weapons access” and “impact of terrorism”, whose relevance to slavery is not directly apparent. One of the datasets, expressed in terms of points, is the response of governments to the Global Slavery Index itself – arguably self-referential. It stands to reason that internally displaced people are included, but refugees were removed because they do not fit into the “five dimensions”. That leaves only 23 variables to measure the susceptibility of a country to slavery. But not all 23 datasets are available for every country. The sometimes-massive gaps are filled in by estimates based on similar countries in the region.
Quantifying slavery in order to build political pressure is a thoroughly worthy project. The publication of a new global index usually stimulates discussions among specialists about the plausibility of assumptions and the informative value of lists of countries. Not so with the GSI. After the publication of the first edition in 2013, four scientists from George Mason University in Arlington, Virginia, in the USA, drew attention to “significant and critical weaknesses”, “improper methods” and
“biased estimates”, and demanded more transparency in the methodology.
Forrester dismissed his critics as “academics”. His team members, who have been working on the GSI for over 10 years, also dodge them. The team has published a series of papers, but has not presented its methods for discussion in a scientific publication. This would have required publishing data and calculation methods. The Walk Free Foundation has published a number of country reports, but they also do not explain how the figures featured in the GSI are arrived at. And they cannot be comprehended even with the help of a “dataset” offered on the GSI website. The Excel spreadsheets cannot simply be downloaded from the website but are sent on request, and they do not contain the details needed to calculate the estimated prevalence. The numbers of enslaved emerge as if out of the fog. The situation is not made any clearer by the publications that – quite rightly – repeatedly draw attention to the estimates and their limited informative value.
Not everything that the Walk Free Foundation publishes is questionable. It has compiled and structured an enormous amount of material about individual countries and the world as a whole. As long as the reports are not based on quantitative hocus-pocus but on qualitative developments, their credibility immediately rises. But this appears as a sideshow, while the foundation is mainly concerned with rankings, bold calculations and spectacular media reports.
The Australian migration expert Anne T. Gallagher noted “the lack of any serious critical interrogation of the GSI” and “an apparent conspiracy of silence”. She criticizes “philanthrocapitalism” in which certain multi-billionaire businesspeople, like Forrester, compete to fund ideas that will result in a glorious, numbers-based improvement of the world. This started with Microsoft founder Bill Gates, who became the world’s most important funder of health projects.
Such initiatives are helpful if they are transparent. But that is not so in the case of the Walk Free Foundation and its index. Gallagher further points out that the Foundation is well-funded, and could underline its sincerity through collaborative projects with notoriously underfunded institutions such as the ILO, and with specialists who are attached to such projects in an advisory capacity. The fifth Global Slavery Index is due to appear in 2022. The bar is high. Maybe it will show that Germany has fewer slaves than Potsdam has residents. In any case, the more credible the GSI is, the more useful it will be.